RT01A - Lower Viñac
Site Code: RT01A. GPS: S12°85054, W75°940725. Elevation: 1032m asl.
Water Quality Data
The following river and water quality data was collected from this site:
| RT01A | July 2019 | November 2019 | November 2021 | March 2022 | June 2022 | |
|---|---|---|---|---|---|---|
| Season: | Austral Winter | Austral Summer | Austral Summer | Austral Summer | Austral Winter | |
| Date: | 10.07.19 | 18.11.19 | 10.11.21 | 21.3.22 | 8.7.22 | |
| Time: | 9.30 | 11.00 | 10.30 | 16.15 | 10.15 | |
| Width (m) | 6.5 | 1.5 | 2.3 | 25.0 | 9.4 | |
| Depth (Av.) (m) | 0.07 | 0.05 | 0.12 | 0.36 | 0.085 | |
| CSA (Av.) (m²) | 0.42 | 0.07 | 0.28 | 9.00 | 0.695 | |
| Velocity (Av.) (m/s) | 0.22 | 0.11 | 0.13 | 0.60 | 0.085 | |
| Discharge (Av.) (m³/s) | 0.094 | 0.008 | 0.036 | 5.400 | 0.226 | |
| Riverbed sediment | Cobbles & Boulders | Cobbles & Boulders | Pebbles, cobbles & boulders | Pebbles & Cobbles | Cobbles & Boulders | |
| Temp. (Atmospheric) (°C) | 26 | 33 | 24 | 22.75 | 27.88 | |
| Temp. (Water) (°C) | 18.87 | 26.84 | 22.61 | 17.71 | 18.62 | |
| Atmospheric pressure (mbar) | 905 | 889 | 880 | 875 | ||
| Dissolved oxygen (mg/l) | 7.90 | 9.63 | 8.26 | 6.41 | 13.25 | |
| Dissolved oxygen (%) | 93.6 | 141.7 | 106.6 | 77.5 | 161.9 | |
| pH | 8.70 | 7.88 | 7.99 | 8.66 | ||
| Conductivity (µS/cm) | 778 | 1111 | 1090 | 84 | 811 | |
| Total Dissolved Solids (ppm) | 389 | 558 | 545 | 42 | 406 | |
| ORP (mV) | 348.4 | 84.4 | -25.0 | 162.2 | 93.9 | |
| Turbidity | Clear: | Clear: slight green | Clear: | Turbid: green | Clear: | |
| Alkalinity (mg/l CaCO₃) | 117 (1.6N) | - | 135 (1.6N) | 50 (1.6N) | 149 (1.6N) | |
| Alkalinity Tester (ppm CaCO₃) | - | - | 122 | 41 | 120 |
Data Analysis
At 6.4-13.25 mg/l the DO readings are almost at full saturation. In November, the higher readings reflect the early processes of eutrophication taking place. This being produced by high rates of photosynthetic activity in the stream, probably as a result of agricultural runoff and sewage wastes. However, aquatic life can survive well at these levels of DO. High concentrations of nutrients (particularly phosphorus and nitrogen) fuel algae blooms, which initially boosts dissolved oxygen levels but then rapidly reduce DO. When the algae die, bacterial decomposition spikes, using up most or all of the dissolved oxygen available. This creates an anoxic, or oxygen-depleted, environment where few organisms survive. Such nutrient levels can occur naturally but are more often caused by pollution from fertilizer runoff or poorly treated waste waters which could apply to this site.
The conductivity readings range from 84 to over 1100 (µS/cm) - both exceptionally high and low. It is almost certainly the case that they reflect both the underlying geology and possibly contanmination from agricultural runoff. Generally, agricultural runoff will increase conductivity due to the additional chloride, phosphate, and nitrate ions. However, geothermal activity higher up the river may significantly increase conductivity when discharge is very low. On the other hand, when discharge is high the geothermal mineral output is significantly dilluted as observed in March 2022.
Recorded levels of pH at around 8.0 are as expected though the November 2021 average recording (7.88) was lower than most recordings in the main river channel. However, the pH of water is still well within the tolerances of most aquatic vertebrates and invertebrates.
Site Description
Site RT01A is the lowest sample site on the Rio Viñac and located just above RC03 at Llangastambo. This is the first tributary of any size in the Rio Cañete catchment, which it joins in the upper tropics at 980m asl. As is common at this elevation, rivers are dry for much of the austral winter. The bed load of huge boulders and rocks is indication of the importance of intermittent catastrophic flooding associated with ENSO.
The valley at this elevation is dominated by salix and acacia species and river cane. Away from the channel the slopes are dominated by xeric vegetative communities. A dominant species here being columnar cacti that may grow to 4m or 5m in height. Along the valley side there are small areas of cultivated land. These are used for subsistence farming and primarily used for maize and plantain production. Water is siphoned form the river to irrigate field using traditional surface flooding methods. Such methods, developed and used extensively in the temperate zone, offer an inefficient use of water. In the headwater areas in the Madean district and higher up large areas are irrigated using the traditional irrigation channels that feed terraced hillsides.
The valley at this point is a narrow and deeply incised in largely sedimentary strata. The channel flow is highly variable from the dry season to the wet season. January to April being the period when channel flow is at its peak. Waters are taken for irrigation and domestic consumption, which greatly affects river flow. As a result, this tributary does not hold water continuously or year-round. The environment at this elevation and indeed latitude is somewhat depauperate with only relictual flora and avifauna. Species found at these elevations include Long-tailed Mockingbird, Scrub Blackbird, Black-necked Woodpecker, Andean Swift and Amazilia Hummingbird.
The progressive drying of the west flank ridges and high Andean habitats will continue to reduce biodiversity along the west flank. A process that will be accelerated by global warming, the melting of the glaciers in the headwaters and consequent increase in water stress in the region. This is already well understood with the dramatic reduction in the extent of snow cover along the Cordillera Occidental from Ancash south to Tacna.
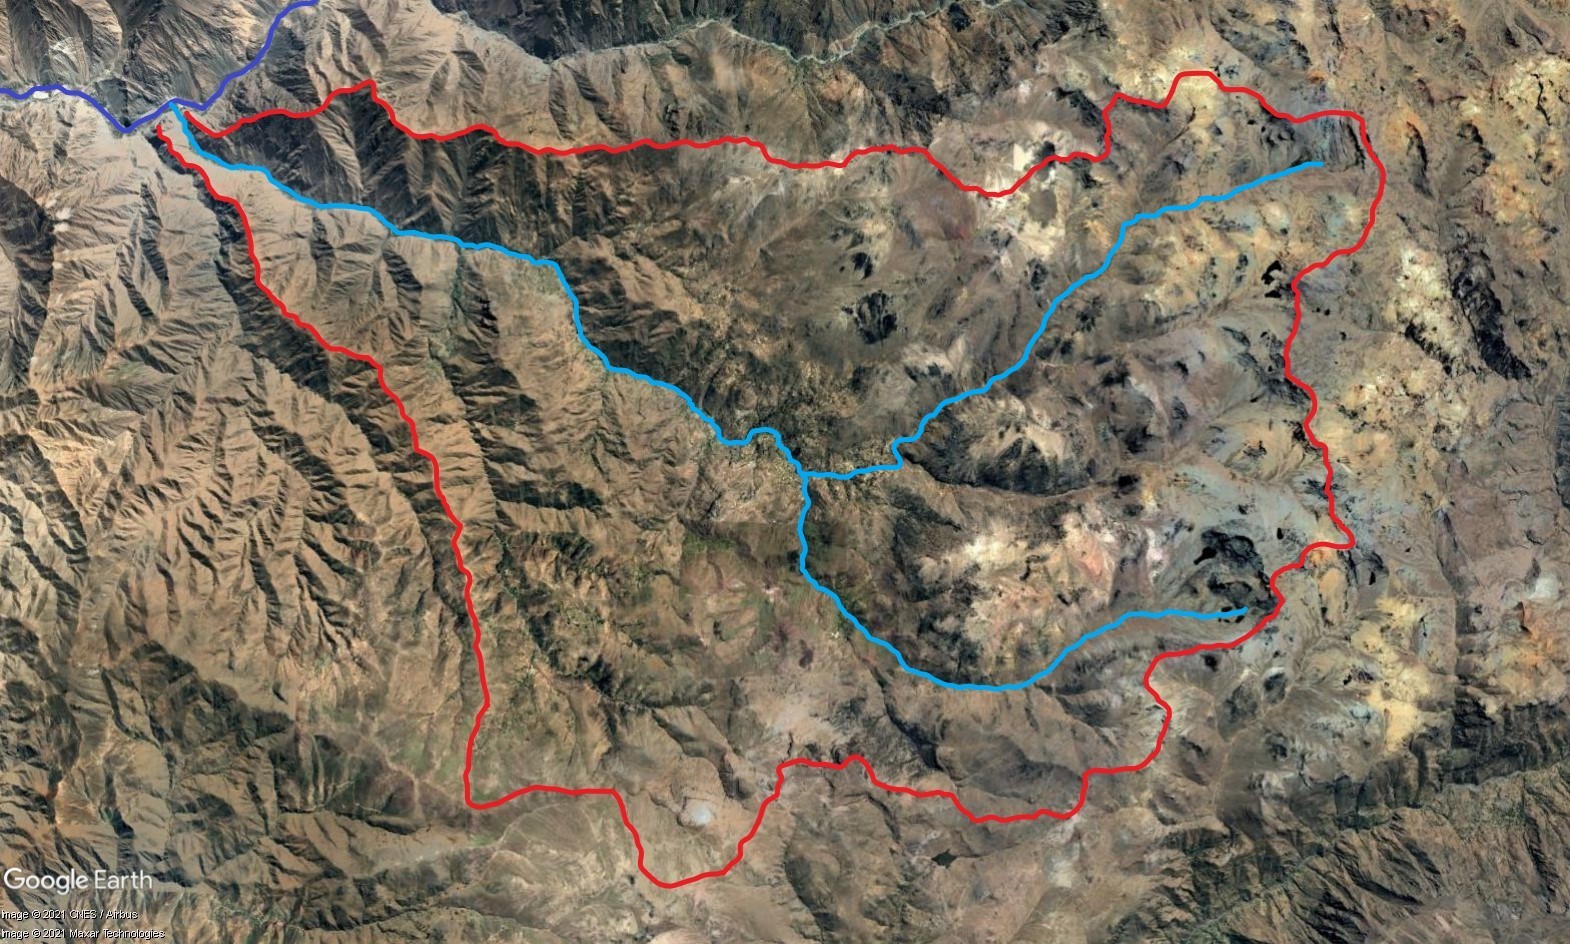 Tributary 01 - the Viñac subcatchment. (Eustace Barnes)
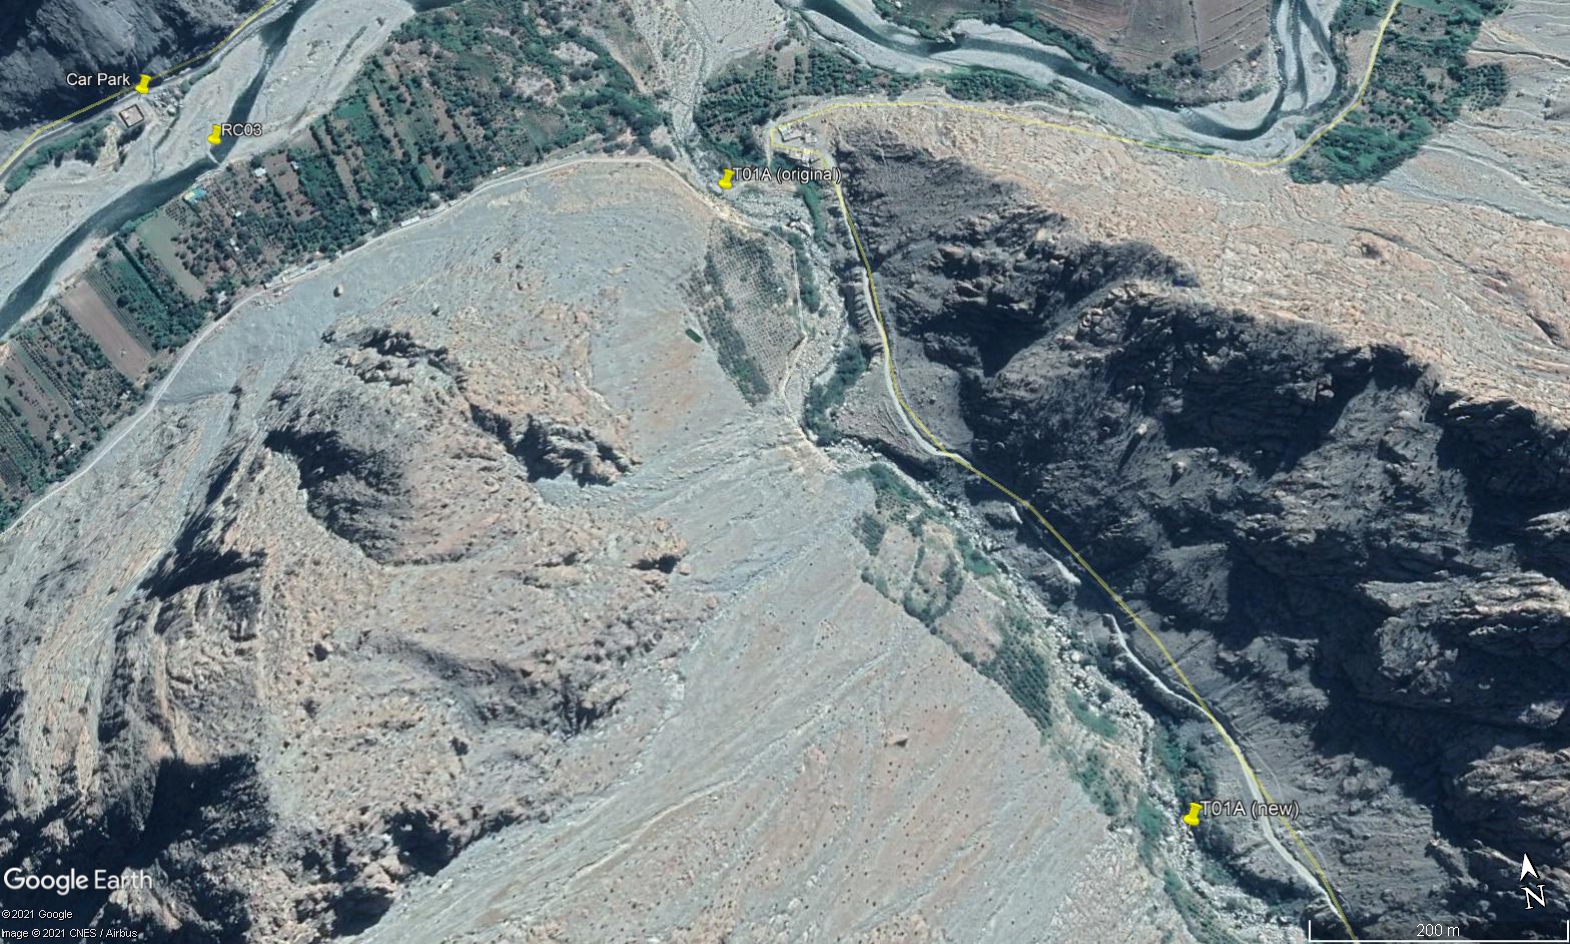 Site RT01A - the (new) study site location: just above Llangastambo. (John Forrest)
.JPG) Site RT01A - the study site. (July 2019) (John Forrest)
Site RT01A - the study site. (July 2019) (John Forrest)
.JPG) Site RT01A - View downstream from the study site. (July 2019) (John Forrest)
Site RT01A - View downstream from the study site. (July 2019) (John Forrest)
.JPG) Site RT01A - View upstream from the study site. (July 2019) (John Forrest)
Site RT01A - View upstream from the study site. (July 2019) (John Forrest)
.JPG) Site RT01A - the study site. (November 2019) (John Forrest)
Site RT01A - the study site. (November 2019) (John Forrest)
.JPG) Site RT01A - View downstream from the study site. (November 2019) (John Forrest)
Site RT01A - View downstream from the study site. (November 2019) (John Forrest)
.JPG) Site RT01A - View upstream from the study site. (November 2019) (John Forrest)
Site RT01A - View upstream from the study site. (November 2019) (John Forrest)