Remote Sensing
In this project, we use various remote sensing tools to analyze vegetation characteristics in Peru. Three levels of data collection are used:
- Field expiditions (Water, plant, and camarones sampling).
- Drone photography and mapping.
- Satellite spectral analysis.
Together, these three levels of data gathering provide large-scale information about the types and quality of vegetation across vast areas that would otherwise be inaccessible. Field expeditions allow us to set a benchmark and validate the spectral analysis from geographic images. An on-site researcher samples the types of plants present in a region and notes the overall health of vegetation. The drone then flies over the same region to expand the area of verified data. Mid-scale data collected from the drone is compared to landsat spectral bands that cover arbitrarily large surfaces. Vegetation type and health can be extrapolated to large areas of Peru with a similar climate to those visited in field expeditions.
Drone Mapping
Using drone technologies, it is possible to cover larger areas in regions of interest and efficiently catalog vegetation type and health.
Drones
The DJI Mavic 2 Pro edition is currently the most powerful drone available on the consumer market. Featuring the unique foldable design of the Mavic Series, a huge maximum speed of up to 45 mph and the longest battery life of up to 31 minutes.
The Mavic 2 Pro utilises a three-axis gimbal with Hasselblad camera and 1-inch CMOS sensor and F\2.8 to F\11 EQV 28mm lens, capable of capturing 4K UHD video and 20MP images. Perfectly designed for sunlight and sunset hours, giving the best results in the most challenging conditions. It is packed with advanced sensors and algorithms that assist piloting and allow flight plans to be programmed to the drone directly.

Key features that make the Mavic 2 Pro a preferred choice for this project:
- Hasselblad camera with a 1-inch CMOS sensor.
- Access to 10-bit Dlog-M colour profile.
- Variable Aperture from F2.8 - F11.
- Max ISO range of 3200 to 12800.
- Omnidirectional sensors for obstacle avoidance.
- Maximum battery life of 31 minutes.
- Programmable for remote sensing applications.
- Foldable and portable to remote locations.
- Relatively low price.
Automated Flight Plans
DroneDeploy
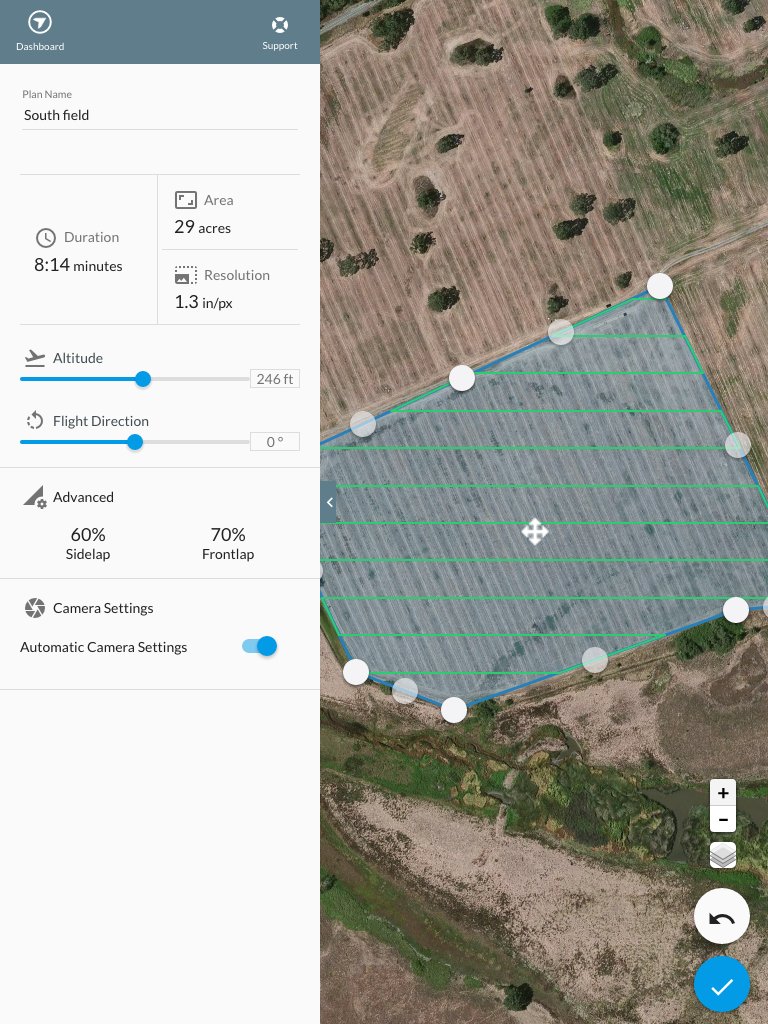
DroneDeploy offer a professional photogrammetry platform for collecting and analysing geographic data using drones. For this project, we are interested in their free flight app for mobile devices. This app allows the automation of flight plans and photography. Gathering land data in a controlled and systematic way is essential for scientific analysis. The image below shows an example plan defined by an operator. The drone automatically covers the region of interest by following the green flight path and takes a number of pictures at an interval defined by the user.
Pix4D
Pix4D is an anternative to DroneDeploy. Using their mobile app, it is possible to program and schedule precise flight paths and data collection tasks.
Data Analysis
OpenDroneMap
OpenDroneMap (ODM) is a free and open-source photogrammetry toolkit for processing aerial images collected from a drone or satellite. It can be used on Windows, MacOS and Linux. For a more user-friendly GUI version of the toolkit use WebODM.
AgiSoft MetaShape
Satellite Mapping
Satellites both public and private are constantly monitoring the surface of the Earth. Processing spectral data from the images taken provides useful information pertaining to the composition of the ground, the presence of vegetation, the type and density of vegetation. A deeper analysis can reveal the effects of industrial activity on the environment over time and the propagation of contaminants via rivers.
Landsat
The Landsat program is the longest-running enterprise for acquisition of satellite imagery of Earth. The program has been operated by NASA, NOAA and USGS. Currently, the two active programmes are Landsat 7 and Landsat 8. Both are capable of collecting multi-spectral data split into differnt bands.
Landsat 7 Enhanced Thematic Mapper Plus (ETM+)
| Bands | Wavelength (micrometers) | Resolution (meters) |
|---|---|---|
| Band 1 - Blue | 0.45 - 0.52 | 30 |
| Band 2 - Green | 0.52 - 0.60 | 30 |
| Band 3 - Red | 0.63 - 0.69 | 30 |
| Band 4 - NIR | 0.77 - 0.90 | 30 |
| Band 5 - SWIR 1 | 1.55 - 1.75 | 30 |
| Band 6 - Thermal | 10.40 - 12.50 | 60* (30) |
| Band 7 - SWIR 2 | 2.09 - 2.35 | 30 |
| Band 8 - Panchromatic | 0.52 - 0.90 | 15 |
- ETM+ Band 6 is acquired at 60-meter resolution, but products are resampled to 30-meter pixels.
Landsat 8 Operational Land Imager (OLI) and Thermal Infrared Sensor (TIRS)
| Bands | Wavelength (micrometers) | Resolution (meters) |
|---|---|---|
| Band 1 - Ultra Blue (coastal/aerosol) | 0.435 - 0.451 | 30 |
| Band 2 - Blue | 0.452 - 0.512 | 30 |
| Band 3 - Green | 0.533 - 0.590 | 30 |
| Band 4 - Red | 0.636 - 0.673 | 30 |
| Band 5 - NIR | 0.851 - 0.879 | 30 |
| Band 6 - SWIR 1 | 1.566 - 1.651 | 30 |
| Band 7 - SWIR 2 | 2.107 - 2.294 | 30 |
| Band 8 - Panchromatic | 0.503 - 0.676 | 15 |
| Band 9 - Cirrus | 1.363 - 1.384 | 30 |
| Band 10 - Thermal 1 | 10.60 - 11.19 | 100* (30) |
| Band 11 - Thermal 2 | 11.50 - 12.51 | 100* (30) |
- TIRS bands are acquired at 100 meter resolution, but are resampled to 30 meter in delivered data product.

Google Earth Engine
Google Earth Engine combines a multi-petabyte catalog of satellite imagery and geospatial datasets with planetary-scale analysis capabilities and makes it available for scientists, researchers, and developers to detect changes, map trends, and quantify differences on the Earth’s surface.
The public data archive includes more than thirty years of historical imagery and scientific datasets, updated and expanded daily. It contains over twenty petabytes of geospatial data instantly available for analysis.
It is a fast and useful tool to process and analyse large quantities of multispectral images of the Earth. An example setup for the online code editor can be seen in the firgure below.

Analysis Methods
NDVI
 Normalized difference vegetation index (NDVI) is a technique that quantifies vegetation by measuring the difference between near-infrared (which vegetation strongly reflects) and red light (which vegetation absorbs). It is a simple tool that is particularly useful for remote sensing application as it provides a quick measure of whether the target being observed contains live green vegetation or not.
Authors
- H. V. Lepage
- C. H. W. Barnes